

Tides: The Ocean Keeps Its Own Beat | Science Lesson Deck
Prompt
Use VIFE Lite to create a four-page, 16:9, editable English popular-science slide deck about tides. The cover uses native geometry for the Moon, the Earth and ocean waves; page 2 explains what causes tides with an Earth–Moon diagram; page 3 clearly contrasts high and low tide, and spring and neap tides; page 4 uses three columns on coastal ecology, harbor navigation and intertidal zone observation. Use a science-museum exhibit-panel style in deep-sea blue, light cyan, moonlight white and coral orange. Label every page "Science explainer example", keep the explanations qualitative, and do not invent fixed tide times or tide heights.
Result
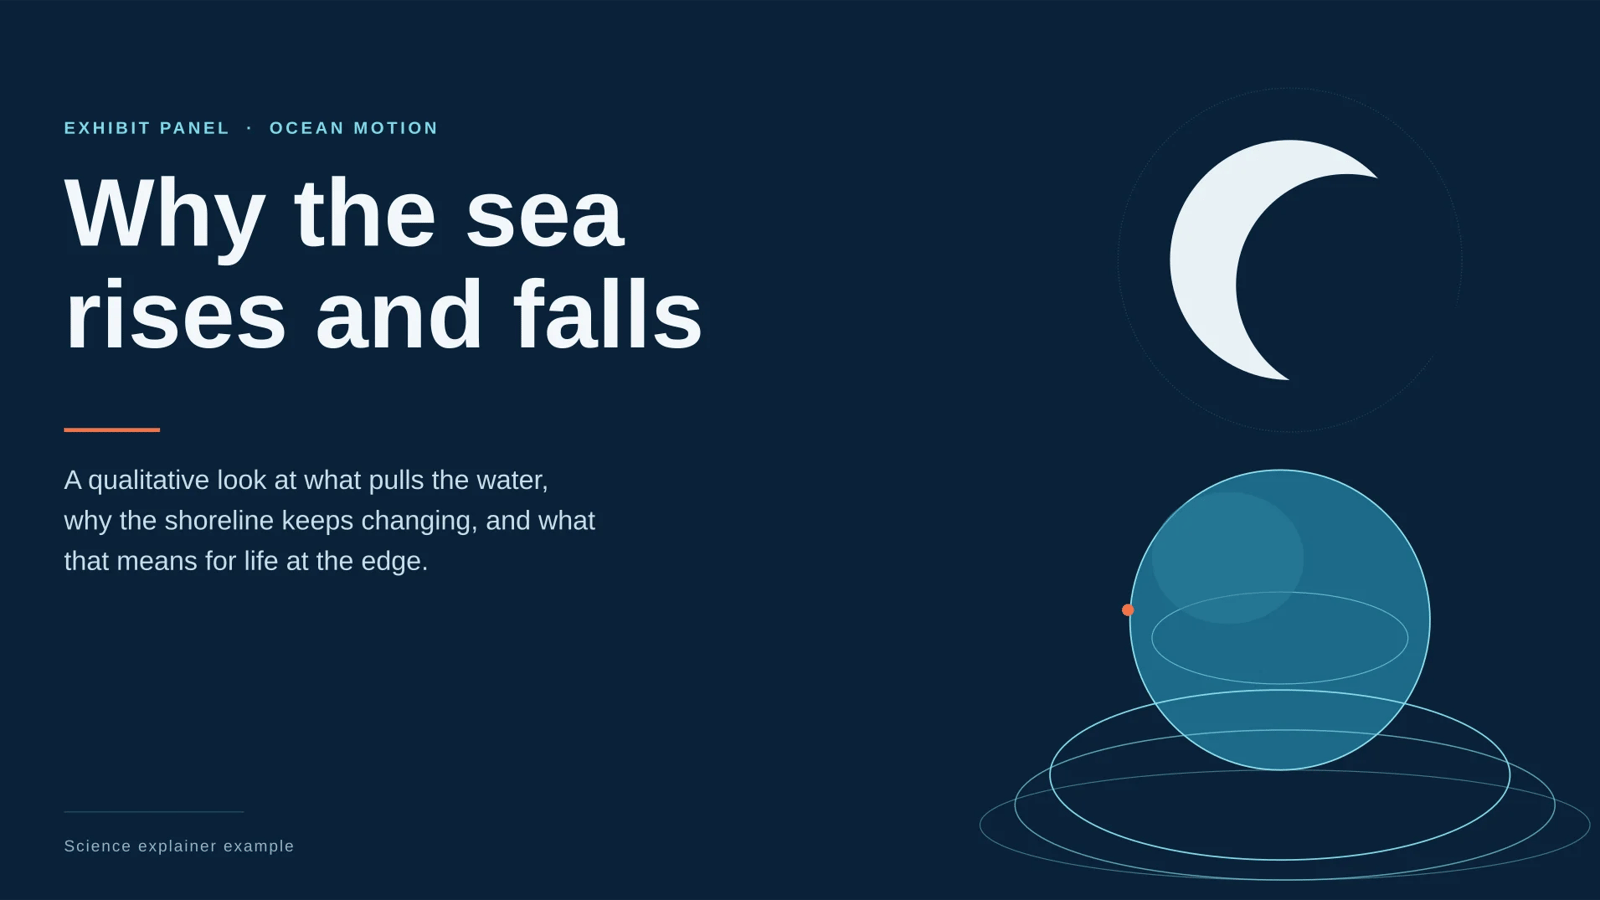
The four-page tides deck is built, fully editable and passed final validation with zero blockers — but its PPTX export is stuck in the platform export queue, so I can't hand you the file yet.
Open the deck: Tides — A Qualitative Science Explainer
What's on the board (1600×900, 16:9, revision 10, four slides authored):
- Cover — a poster composition anchored on the left margin; the Moon, the Earth and the ocean waves are drawn as native editable geometry (moon disc with an offset crescent shadow, cyan Earth with equator and sheen ellipses, layered swell arcs spilling toward the bottom edge), not an image.
- What causes tides — an Earth–Moon diagram with an elliptical water envelope, the near-side and far-side bulges, hairline leaders and short passages on the Moon's pull, the far-side bulge and the Sun's contribution.
- High vs low, spring vs neap — a 2×2 quadrant, one mini-diagram per cell: water-level basins for high and low tide, Sun–Earth–Moon alignment for spring (aligned, greatest range) and neap (right angles, smallest range). The neap diagram was misplaced into the spring cell in an earlier pass; it now sits in its own quadrant.
- Three columns — coastal ecology, harbor navigation, intertidal zone observation, each with a drawn glyph anchor and short qualitative lines, closing on why the same pull reads differently coast to coast.
Every page carries the panel label "Science explainer example". Style is the science-museum exhibit panel: deep-sea blue ground (#0A2239) on all four pages, moonlight-white type, light-cyan linework, coral orange as the single accent, Arial throughout, one fixed type scale. All explanatory copy stays qualitative — no tide times, clock times, intervals, dates or heights anywhere, and the only numerals are the page indices.
What's still open, stated plainly:
- No PPTX file yet. Export job
5c9679b1-0c2f-594c-b8ec-bfaaf35bee5chas sat at "queued / progress 0" with its timestamp frozen since submission; a fresh export was refused withPRESENTATION_EXPORT_ALREADY_ACTIVE(recovery: do not retry). The deck itself is complete and validated, so nothing needs rebuilding — only that queue entry has to clear. You can also export directly from the deck panel, or tell me to retry in a new message. - 7 warnings, no blockers: on page 3, six diagram labels ("Sun", "Earth", "Moon") sit at 15 design units and two letter-spaced column tags at 14 — legible in the editor, but small at print size. Say the word and I'll raise them.
- Minor: page 4 carries the "04 / 04" index at lower right; pages 1–3 don't (the additive node calls to add it were rejected by the authoring API, so I left the accepted pages untouched rather than risk them). Page 4's two glyph paths are editable vectors, not raster — still fully editable, just a path rather than a primitive shape.
How it was made
- Mode
- Slides
Related presentation prompts
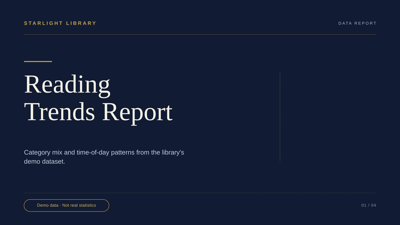
Starlight Library | Reading Trend Insights
Presentation
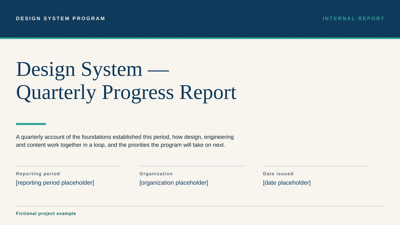
Design System | Quarterly Progress Report
Presentation
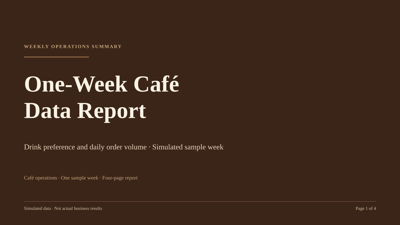
Café Data | A Simulated One-Week Report
Presentation
TRAIL JOURNAL | Travel Journal App Concept Launch
Presentation
ISLAND WEATHER | Island Weather Sample Report
Presentation
Urban Heat Island | Simulated Sample Observations
Presentation
FRAME Museum | Exhibition Project Retrospective
Presentation
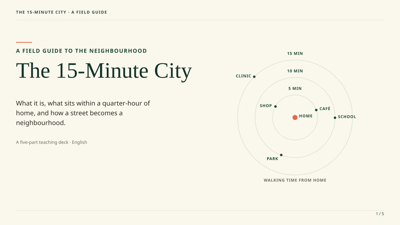
The 15-Minute City | A Field Guide
Presentation