

Urban Heat Island | Simulated Sample Observations
Prompt
Use VIFE Lite to create a four-page, 16:9, editable native English data report deck on a fictional urban heat island sample. The cover uses city building silhouettes and a cool-to-warm temperature band; page 2 uses a horizontal bar chart to compare surface temperatures at the same hypothetical moment: Tree shade 29°C, Park lawn 31°C, Residential street 34°C, Paved plaza 38°C; page 3 highlights the 9°C gap between the hottest and coolest spots; page 4 uses three cards to propose design directions that need real-world validation, such as shade, permeable green space and pedestrian comfort. Use midnight blue, sand white, coral red and mint green, label every page "Simulated data · Not measured", and do not present the sample differences as causal conclusions.
Result
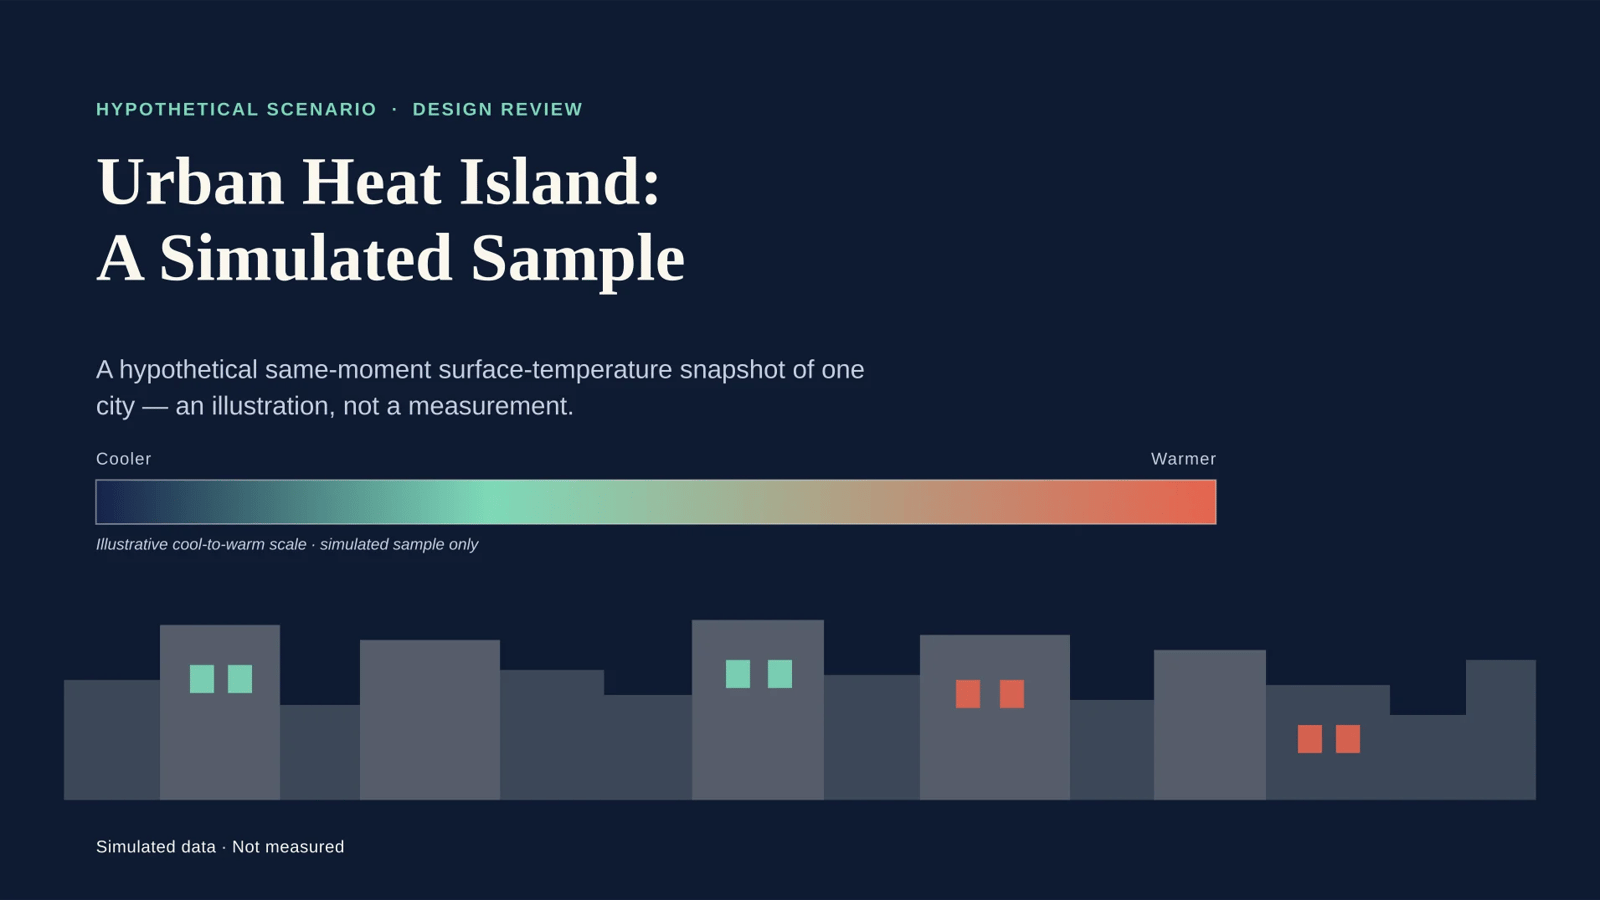
Your four-page, 16:9 native English deck is ready and exported as an editable PPTX (VIFE Lite).
What's in it
- Page 1 — Cover: "Urban Heat Island: A Simulated Sample", native vector city skyline (mint window accents on the cool side, coral on the warm side) and a cool-to-warm temperature band labelled Cooler → Warmer.
- Page 2 — Comparison: native editable horizontal bar chart, coolest first — Tree shade 29°C, Park lawn 31°C, Residential street 34°C, Paved plaza 38°C (unit °C).
- Page 3 — The gap: single dominant stat 9°C, with the derivation shown (38°C − 29°C = 9°C) and both endpoints named.
- Page 4 — Directions: exactly three cards — Shade, Permeable green space, Pedestrian comfort — each marked "PROPOSED DIRECTION" with "Requires real-world validation — field measurement or a pilot study before any conclusion."
Constraints met
- Palette held to midnight blue, sand white, coral red and mint green (plus midnight-blue-family neutrals) — no fifth accent hue.
- "Simulated data · Not measured" appears as a visible label on all four pages.
- No page, chart label, card or speaker note presents the sample differences as causal, measured or forecast; the framing is a hypothetical same-moment snapshot throughout.
- Fully native and editable — text, shapes and a real chart object; no raster or flattened images (so no generated imagery and no image spend).
- Deck id
ed6c5a07-a097-5949-8e47-771e5ee72ac7— keep it if you want later edits.
Disclosures
- Final validation reported zero blockers and zero warnings.
- The native bar chart uses a 0-based value axis (the authoring schema exposes no axis-minimum setting), so the bars differ less dramatically than the 29–38 spread suggests; the exact values ride on the data labels.
- The child's own visual QA rested on node geometry and the deterministic validator, not on a rendered preview of the exported file — open the PPTX once to confirm the look before sharing.
How it was made
- Mode
- Slides
- Template
- Report to deck
Related presentation prompts
FRAME Museum | Exhibition Project Retrospective
Presentation
The 15-Minute City | A Field Guide
Presentation
NOVA | Quarterly Work Review
Presentation
LUMEN | Home Energy Services Business Proposal
Presentation
AURA | Modular Desk Lamp Concept Launch
Presentation
SPROUT | Urban Farm Subscription Business Proposal
Presentation

KITE | Product Team Iteration Retrospective
Presentation

MIRA — A Quiet Pause | Fragrance Brand Launch
Presentation