

Café Data | A Simulated One-Week Report
Prompt
Use VIFE Lite to create a 4-page editable English one-week café data report. The cover uses coffee brown and cream white; an editable chart shows drink preferences: Americano 35%, Latte 30%, Pour-over 20%, Tea 15%; daily orders for the week are shown as 48, 52, 44, 55, 61, 86, 74; and three cards close by summarizing what the sample shows. All figures are simulated; label every page "Simulated data · Not actual business results".
Result
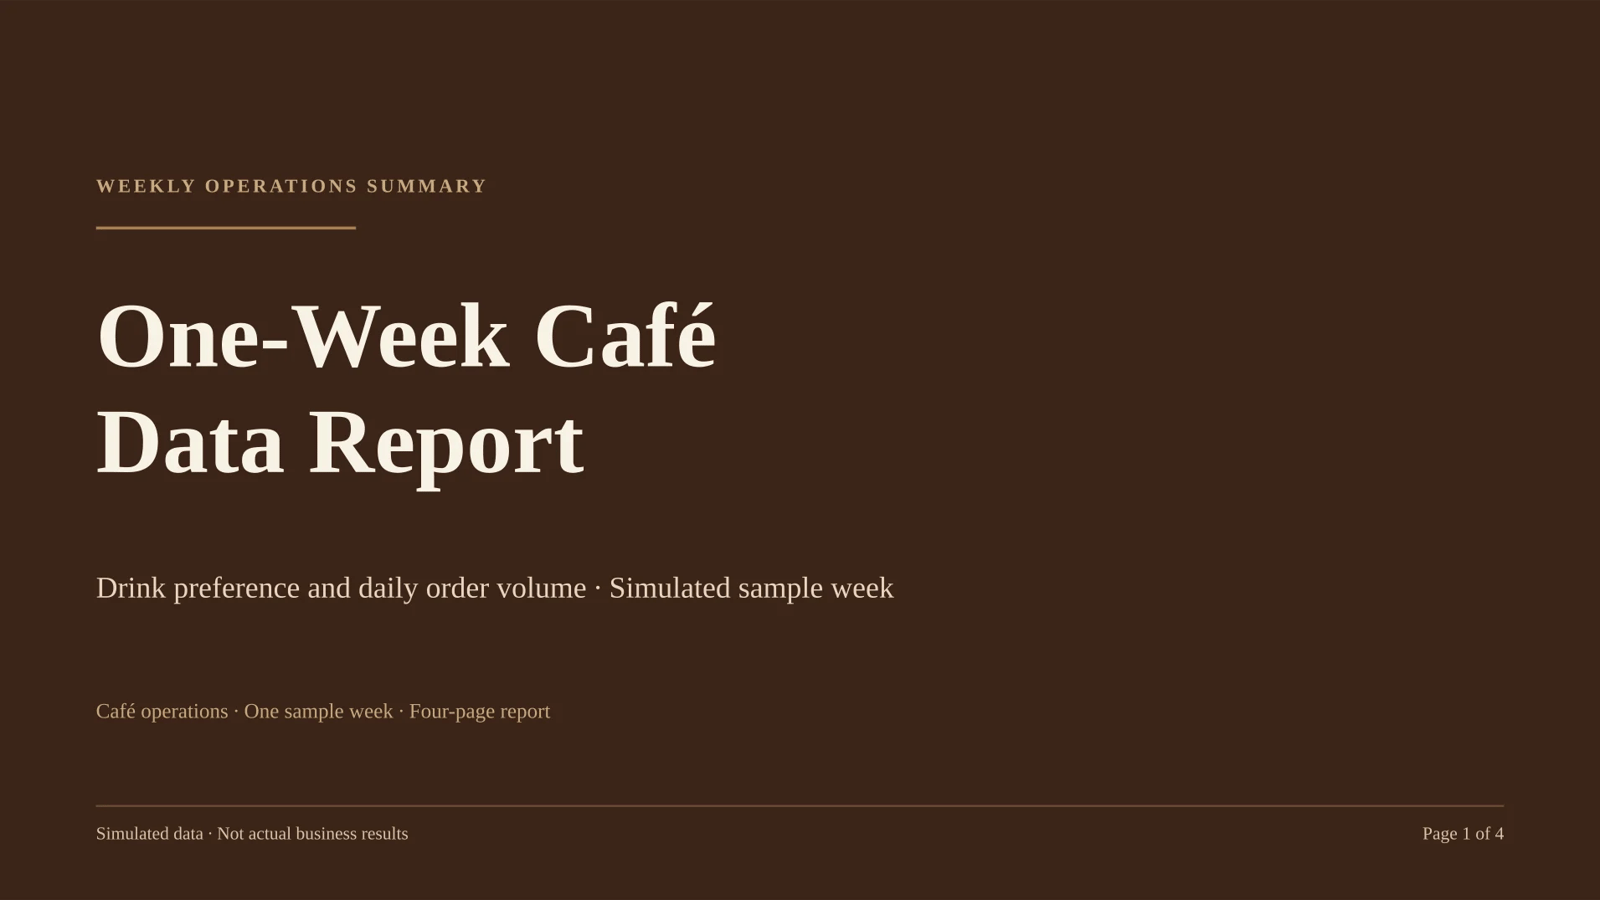
Your report is ready as an editable 4-page PowerPoint file.
What's inside
- Cover — espresso-brown field, cream serif title "One-Week Café Data Report", subtitle noting the simulated sample week.
- Drink preference — native editable bar chart: Americano 35%, Latte 30%, Pour-over 20%, Tea 15% (totals 100%), with a short neutral observation column.
- Daily orders — native editable column chart, Monday–Sunday: 48, 52, 44, 55, 61, 86, 74, with the arithmetic reading (420 total, 60 average, Saturday 86 high, Wednesday 44 low).
- What the sample shows — three equal cards: Volume (420 / 60 per day), Weekend lift (Sat 86, Sun 74 above the 60 average; Sat ≈43% higher), Americano leads (35% share, 65% espresso-based).
Checks: 4 pages exactly; both charts are real chart objects you can edit in PowerPoint (data, not pictures); exactly three cards on the last page; palette is coffee brown + cream with a tan accent and Georgia throughout; validation returned zero warnings.
"Simulated data · Not actual business results" appears as a footer on all four pages, cover included. Every figure is exactly the set you supplied — no revenue, cost or other invented metrics.
Deck id for later edits: 77058d07-606e-5a40-a2a6-1485e6eec9d3.
How it was made
- Mode
- Slides
Related presentation prompts
TRAIL JOURNAL | Travel Journal App Concept Launch
Presentation
ISLAND WEATHER | Island Weather Sample Report
Presentation
Urban Heat Island | Simulated Sample Observations
Presentation
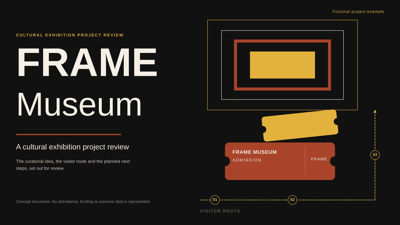
FRAME Museum | Exhibition Project Retrospective
Presentation
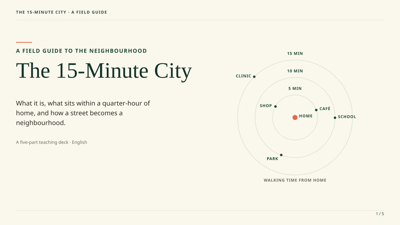
The 15-Minute City | A Field Guide
Presentation
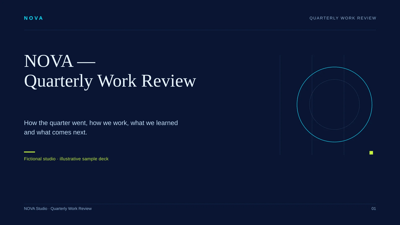
NOVA | Quarterly Work Review
Presentation
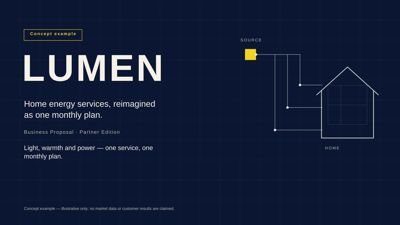
LUMEN | Home Energy Services Business Proposal
Presentation
AURA | Modular Desk Lamp Concept Launch
Presentation