

ISLAND WEATHER | Island Weather Sample Report
Prompt
Use VIFE Lite to create a four-page, 16:9, editable native English data report deck on a fictional island weather sample. The cover is a geometric composition of sunlight, clouds and the sea horizon; page 2 uses an editable line chart for a week of temperatures: 22, 23, 24, 26, 25, 23, 21°C; page 3 uses an editable column chart for rainfall: 0, 0, 2, 0, 8, 4, 1 mm, highlighting Friday; page 4 sums up that temperatures rise and then fall, that rain is concentrated in the second half of the week, and the limits of the sample. Use a weather-almanac style in navy blue, mist blue, sunshine yellow, coral red and warm white, and clearly label every page "Simulated data · Not a real forecast".
Result
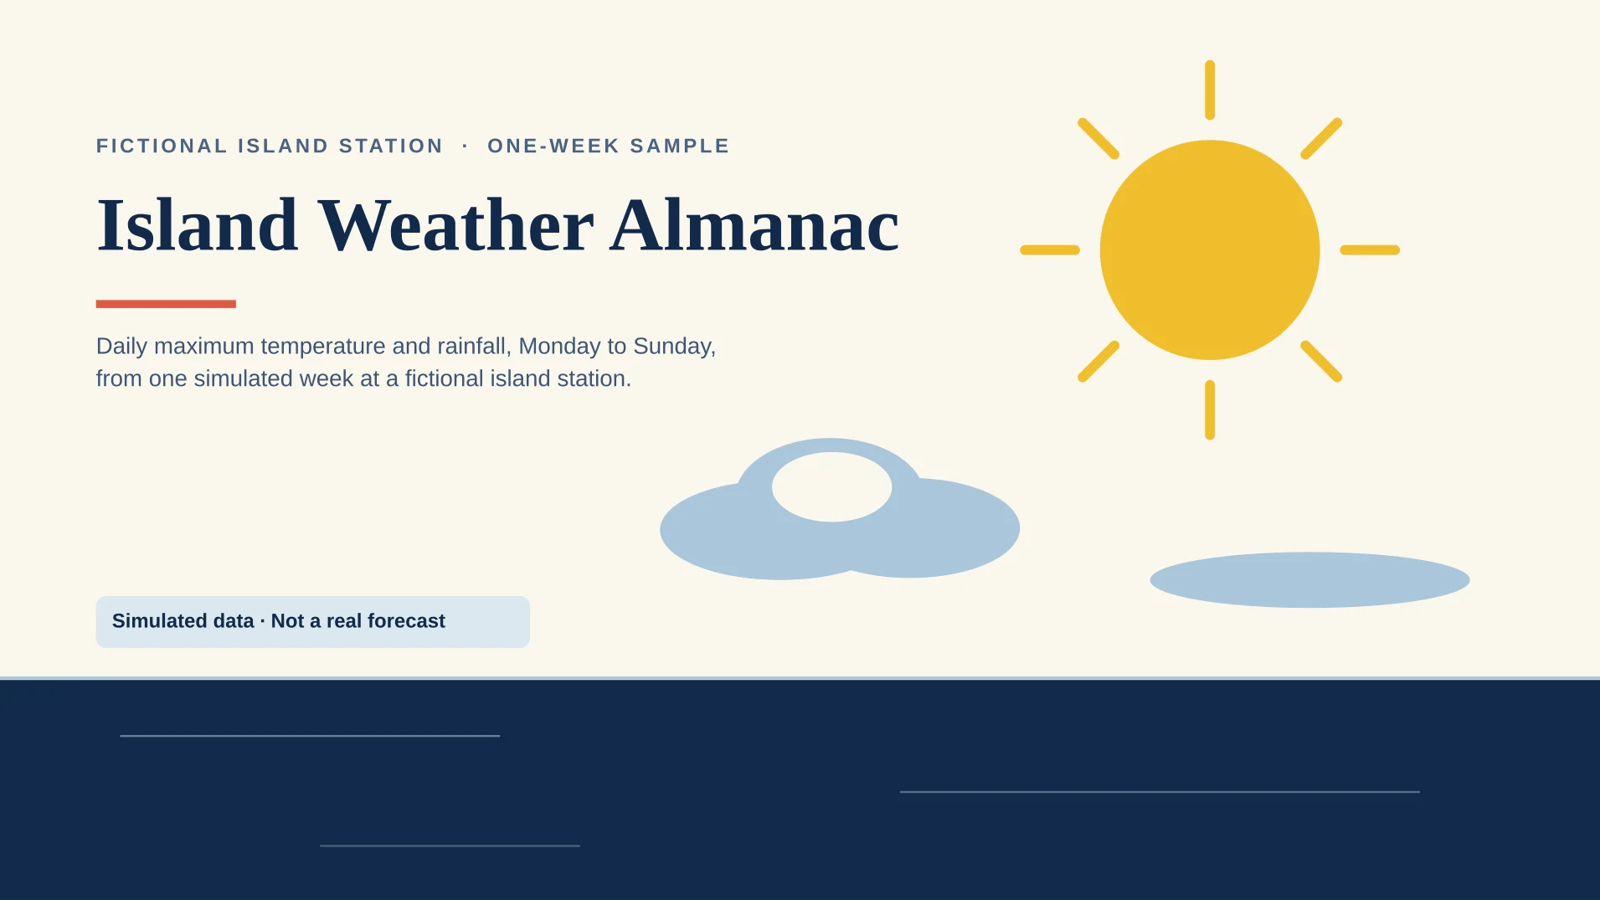
Island Weather Almanac — One-Week Sample · 4 pages · 16:9 · English · fully editable native PPTX.
What's on each page
- Cover — "Island Weather Almanac", geometric plate built from native vector shapes: yellow sun disc with eight radiating strokes, layered mist-blue/warm-white cloud forms, navy sea-horizon band, coral accent rule.
- Daily maximum temperature — headline "Temperature climbs to 26 °C on Thursday, then falls to 21 °C" over a real editable line chart (Mon 22, Tue 23, Wed 24, Thu 26, Fri 25, Sat 23, Sun 21 °C, value axis labelled °C).
- Daily rainfall — editable column chart (Mon 0, Tue 0, Wed 2, Thu 0, Fri 8, Sat 4, Sun 1 mm) with Friday's 8 mm peak drawn as a coral column plus a "Friday · week's peak" callout and leader.
- What the sample shows — three findings (rise-then-fall temperature arc; rain concentrated in the second half, 15 mm total; limits of a single simulated week) plus stat callouts 15 mm / 26 °C / 21 °C.
Style: almanac plate in navy #12294B, mist blue #A9C6D9, sunshine yellow, coral #E4572E on warm-white paper; Georgia headlines, Arial body, coral rule under every headline, fixed footer rail. Every page carries the line "Simulated data · Not a real forecast" — verified in the exported file on all four slides.
Disclosed, not hidden
- Final validation passed with zero blockers and one warning:
PRESENTATION_PRIMARY_VISUAL_MISSINGon the cover, because the cover's primary visual is native vector geometry rather than an image node (an image would have broken the editable, no-raster requirement). - The temperature chart uses the engine's automatic value-axis range (the native chart schema exposes no min/max); the arc is also stated in the headline, caption and summary.
- Text and chart data were verified from the exported file; the rendered-SVG visual review of the chart regions was only partial because the SVG payloads truncated before the chart area. If anything looks off on screen, tell me which page and I'll repair it in the same deck.
Presentation id for later edits: 3ffae3d2-77b2-53b5-ba8c-f5330fb76f3b.
How it was made
- Mode
- Slides
Related presentation prompts
Urban Heat Island | Simulated Sample Observations
Presentation
FRAME Museum | Exhibition Project Retrospective
Presentation
The 15-Minute City | A Field Guide
Presentation
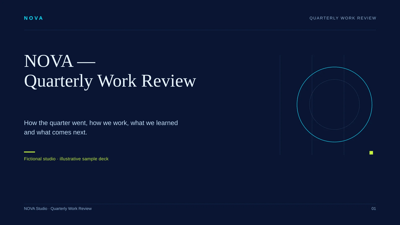
NOVA | Quarterly Work Review
Presentation
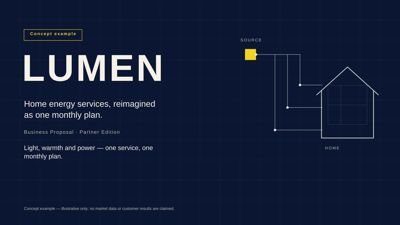
LUMEN | Home Energy Services Business Proposal
Presentation
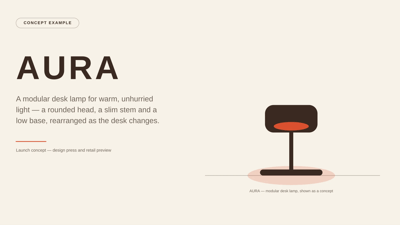
AURA | Modular Desk Lamp Concept Launch
Presentation
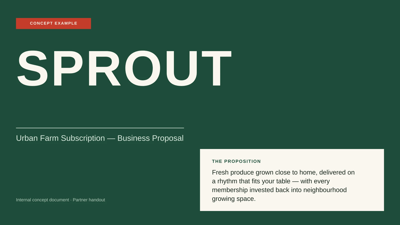
SPROUT | Urban Farm Subscription Business Proposal
Presentation

KITE | Product Team Iteration Retrospective
Presentation