

Starlight Library | Reading Trend Insights
Prompt
Use VIFE Lite to create a 4-page, 16:9, editable English data report on fictional reading trends: a Starlight Library cover; a horizontal bar chart of Literature 32%, Popular Science 28%, History 24%, Art 16%; a time-of-day chart of Morning 20%, Afternoon 35%, Evening 30%, Night 15%; and three insight cards. Use midnight blue, cream white and warm gold, give each page a different layout, and label every page "Demo data · Not real statistics".
Result
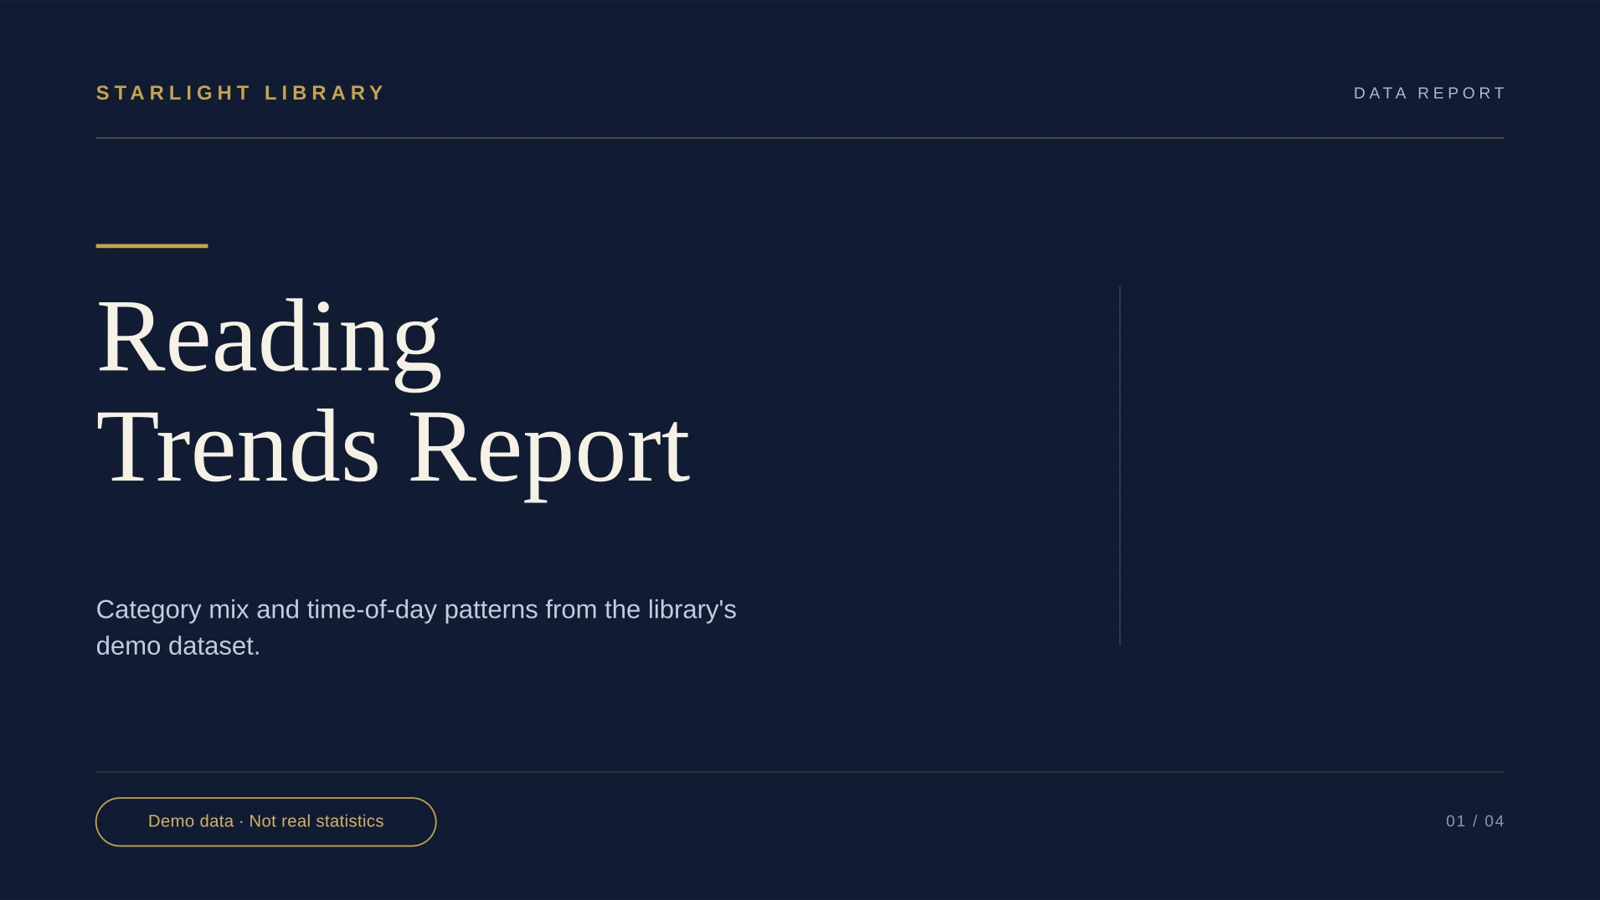
Your 4-page, 16:9, fully editable English deck is ready.
Pages
- Cover — full-bleed midnight navy, gold wordmark, large serif title, gold hairline rule, demo-data pill.
- Reading preferences by category — cream page, four horizontal bars drawn to scale: Literature 32% (gold, leading), Popular Science 28%, History 24%, Art 16%, each with its name and exact percentage.
- When readers visit — navy page, one full-width proportional band: Morning 20%, Afternoon 35% (gold peak), Evening 30%, Night 15%, with 0%/100% end ticks.
- Three things the data suggests — cream page, three equal insight cards (afternoon peak; Literature leads while Art trails; afternoon + evening = 65%), each opened by a gold numeral.
Design: midnight blue / cream white / warm gold throughout, one type system (Georgia headings, Arial body), consistent 96-unit margins and hairline rules — four visibly different layouts, no imagery.
Checks: every page carries the label "Demo data · Not real statistics" (verified in the text of all four slides), all eight values match your figures exactly, charts are native shapes and text so everything is editable in PowerPoint, and final validation passed with zero blockers.
One thing I want to be straight about: three low-contrast warnings remain on the decorative gold "01 / 02 / 03" numerals on page 4 (2.24:1 against the cream card, below the 3:1 guideline for large text). I tried to deepen that gold, but the editor refused the colour-only change twice, and I would not risk rebuilding the page to chase a cosmetic warning. The numerals are 42pt and still readable in print; if you want them darker, say so and I'll handle it another way.
Presentation id for future edits: 4afcaa69-a295-5bd3-b8cc-1c13ca558a90.
How it was made
- Mode
- Slides
Related presentation prompts
Design System | Quarterly Progress Report
Presentation
Café Data | A Simulated One-Week Report
Presentation
TRAIL JOURNAL | Travel Journal App Concept Launch
Presentation
ISLAND WEATHER | Island Weather Sample Report
Presentation
Urban Heat Island | Simulated Sample Observations
Presentation
FRAME Museum | Exhibition Project Retrospective
Presentation
The 15-Minute City | A Field Guide
Presentation
NOVA | Quarterly Work Review
Presentation